Server Load Monitor | Product Documentation
We have introduced the “Server Load Monitor” which is visible on your Server Panel. In this article, I’ll explain how you can assess the health of your server’s computing resources (CPUs) using the server load monitor.
Do not get confuse between the Server Load Monitor and the Server Health Monitor. While the Server Health Monitor offers comprehensive information on CPU, memory, and disk usage, the Server Load Monitor focuses solely on CPU usage but does so with high precision.
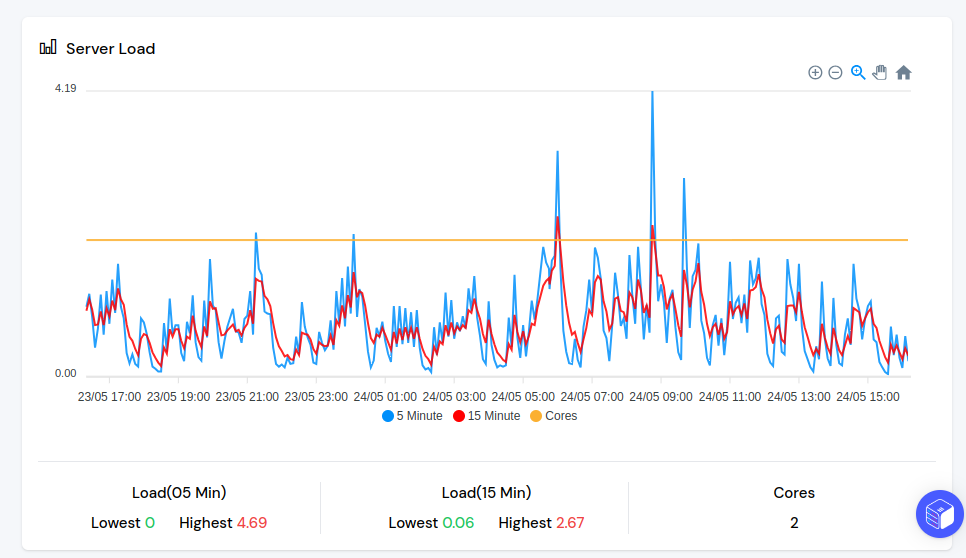
The example given below is from one of the servers in ServerKade’s network.

Based on this chart, I can provide observations about the server, even without knowing the type of site it hosts:
- This server is really reliable. This means that the application hosted on this server is very stable and well-developed, and it is running smoothly.
- There have been some traffic spikes or other updates going on, which can be seen in the server load monitor as spikes.
If you see the same thing in the chart, that’s great! If you’re not sure what’s happening, let me explain.
The Server Load Monitor contains 3 series, which are:
- 5 Minutes load average (Blue series)
- 15 Minutes load average (Red series)
- Cores (Yellow series)
The “Cores” series shows the number of cores your server has at a specific time. The following server has 2 cores, and there were no upgrades performed recently, so that series has not changed.
The “Load” represents the average workload distributed among all your vCPUs during a specific period. It’s a numerical value such as 0.16, 3.45, 76.67, or any other number.
Depending on your application and server configuration, there’s a fundamental threshold that the server load should not exceed, or else your application’s performance will suffer. For instance, if your server has 10 vCPUs and the load average for a given time period is 11, it’s acceptable. However, surpassing the range of 13-15 (depending on your application) will result in decreased server performance.
In the following screenshot, you can see that there are many spikes above 2 as a threshold. To understand this, let’s understand the importance of 5 minutes, and 15 minutes load averages.
If the 5 minute load average goes higher than 130-140% and it stays there for longer than 5-10 minutes, you have a huge spike and a huge requirement of computing power than you currently have. And it will also cause the 15 minutes load average to rise.
If the 15 minutes load average goes higher than 110% of the threshold, your application starts slowing down. In the following screenshot, the 15-minute load average (shown in red) consistently remains at or near the threshold. This indicates that the site may experience slowness sometimes, but the difference is insignificant.
That is why the application(s) on the following server is working just fine right now. But if it gets a huge flow of visitors, the site will slow down with the current configuration. Sooner or later, the owner of this application has to upgrade the server. Right now, the owner of this server is getting a 100% return on investment constantly for the server.
Memory also affects server load. If your server lacks memory, it will start swapping data between the memory and swap space, which can slow down the server and require additional computing power. Therefore, it is important to ensure that your server is not swapping too much. We will add swap memory usage to the dashboard so you can monitor this as well.


